
Fig. 2a–c,g–i
HER2ST cohort
Eleven methods in eight patients with HER2-positive breast cancer: normalized pairwise accuracy for three sets of spot pairs, and method ranks.
The sections and saved results behind Figures 2 to 6, to explore gene by gene and sample by sample. Every figure can be downloaded as SVG or PNG, with its data. Results goes through all figures of the paper.
Eleven methods in eight patients with HER2-positive breast cancer: normalized pairwise accuracy for three sets of spot pairs, and method ranks.
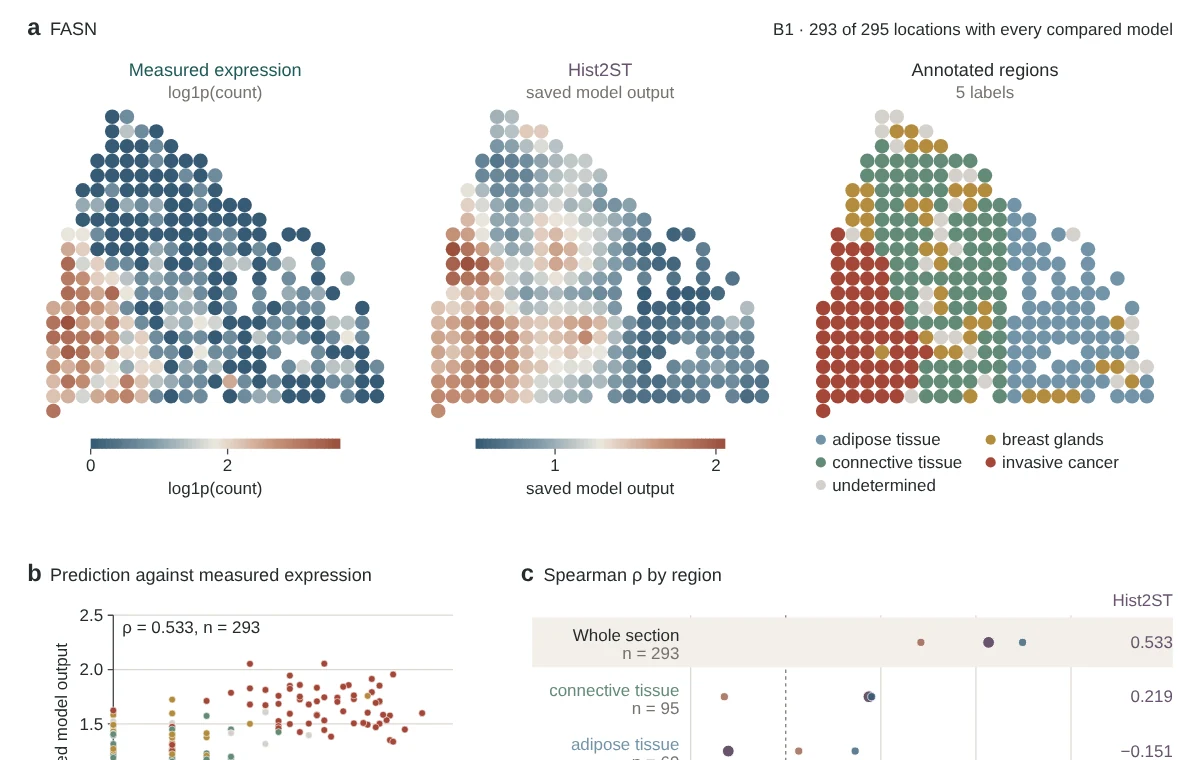
Measured expression of 785 genes at 295 spots, the saved predictions of Hist2ST, EGNv2 and DeepSpaCE, and the annotated regions. Any gene, over the whole section, within each region and in larger bins.
One lung cancer sample, 50 genes at 1,944 spots, predicted by Ridge-Phikon-v2 after standard training and with the pairwise difference loss.
Three single-cell methods in five patients: RSC within malignant cells at five scales, all cells after averaging into bins, and proliferation hotspots checked against measured RNA.
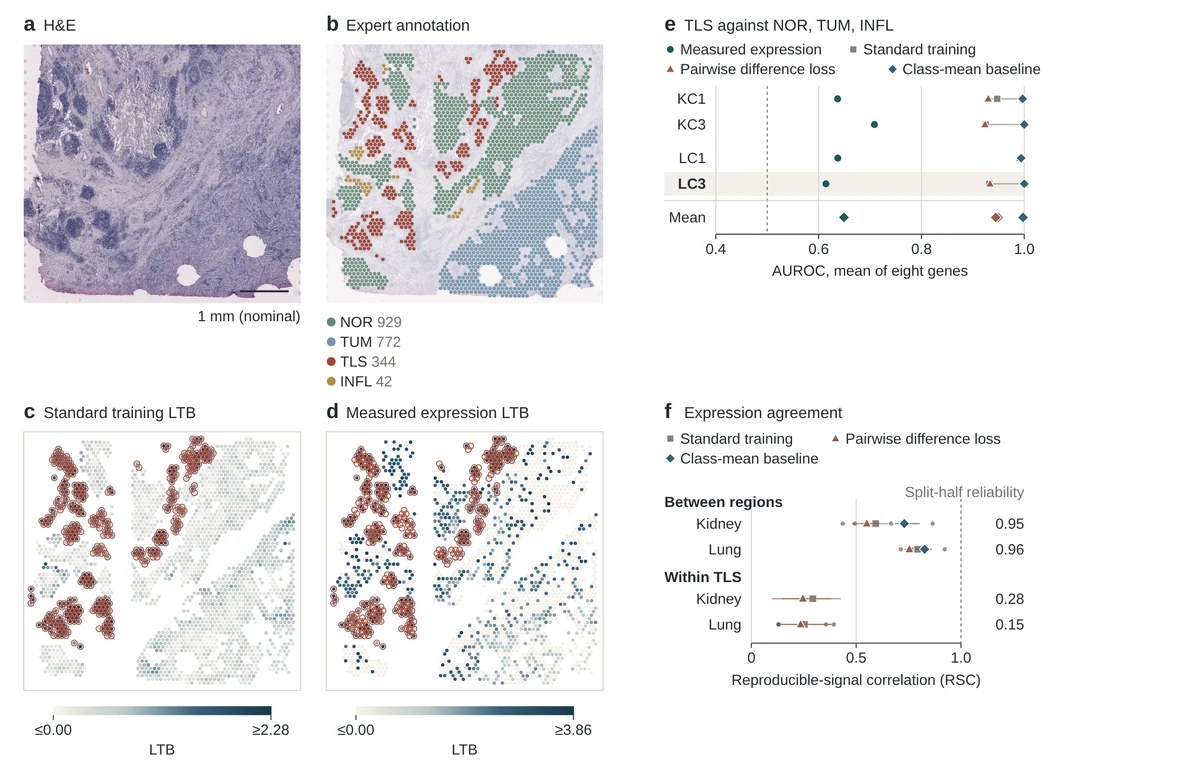
Two kidney and two lung sections with expert annotations: eight TLS genes, measured and predicted, the H&E of lung section LC3, and RSC between regions and within TLS.